Just a Few Examples from the 25,000+ Websites We’ve Optimized
With over 10 years of experience in website optimization, we’ve improved the performance of more than 25,000 projects — from slow online stores to bloated blogs. Below are a few real examples where we reached 90+ PageSpeed scores and significantly reduced loading times.
This isn’t theory. Below are real examples showing:
🧩 Site #1: Milanis.top — Manual Database Cleanup and Full Site Optimization
Site type: WooCommerce store selling premium bridal veils for the U.S. market
🔍 Problem
Despite its beautiful frontend, the site suffered from poor performance, especially on mobile devices.
Initial diagnostics revealed:
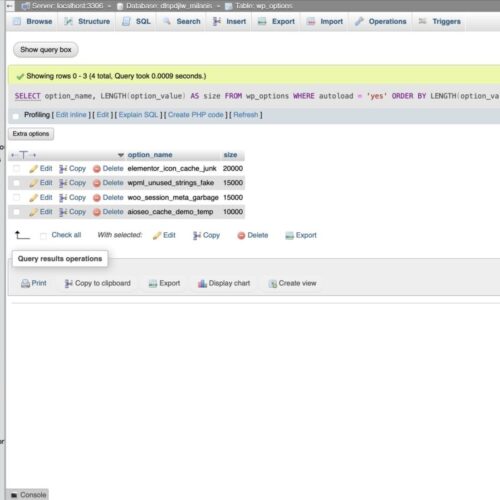
Bloated autoloaded options in the database (
wp_options)Over 12,000 oversized images
No proper cache warm-up, causing cold loads
Dozens of unnecessary scripts and styles on every page
Slow TTFB under mobile or low-speed networks
A sluggish admin dashboard experience
🛠 What we did (Manual First Approach)
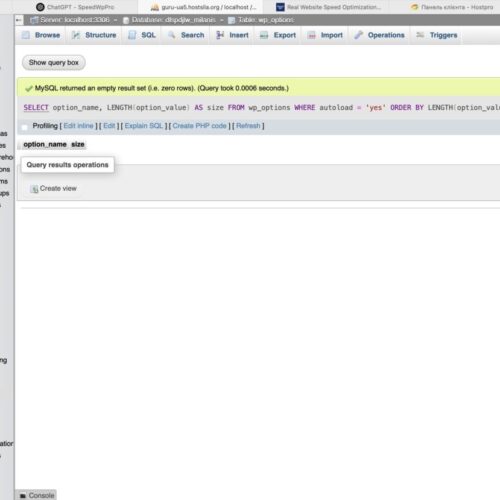
✅ Manually cleaned the database, focusing on oversized
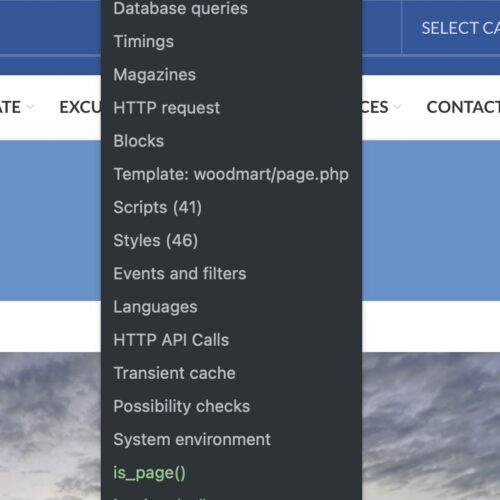
autoloadentries via targeted SQL queries✅ Used Query Monitor to trace slow queries and unused scripts
✅ Resized 12,000+ images to max width of 1200px using ImageMagick
✅ Minified and deferred CSS/JS manually to avoid layout shifts and CLS
✅ Removed unused external fonts, emojis, and leftover plugin data
✅ Set up automated cache preloading via a custom Cloudflare API + sitemap + bash script
✅ Installed Advanced Database Cleaner Pro for ongoing DB hygiene
✅ Deployed Docket Cache to speed up the admin dashboard without Redis/Memcached
⚙️ Caching Strategy
To ensure long-term frontend performance:
Replaced WP Fastest Cache with LiteSpeed Cache
Tuned it for shared hosting with Cloudflare integration
Disabled object cache in LiteSpeed (due to hosting limits) to avoid conflict with Docket Cache
⚡ Results
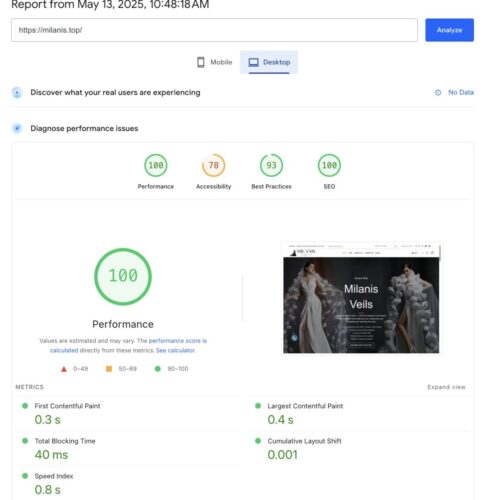
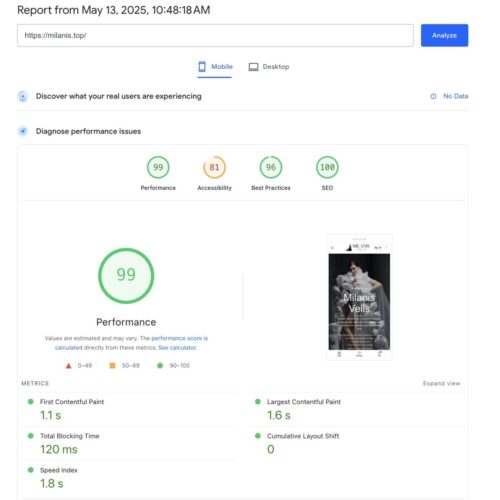
✅ Mobile PageSpeed score: 99
🚀 Fully loaded homepage: < 1.2 seconds
🟢 LCP: under 2s, CLS: 0.02
💚 All Core Web Vitals: green
⚙️ Admin dashboard load time: 0.36s, memory use: 39MB
🧰 Tools Used
LiteSpeed Cache, Docket Cache, ImageMagick, Advanced Database Cleaner Pro, Cloudflare API, Query Monitor, DevTools, bash scripting
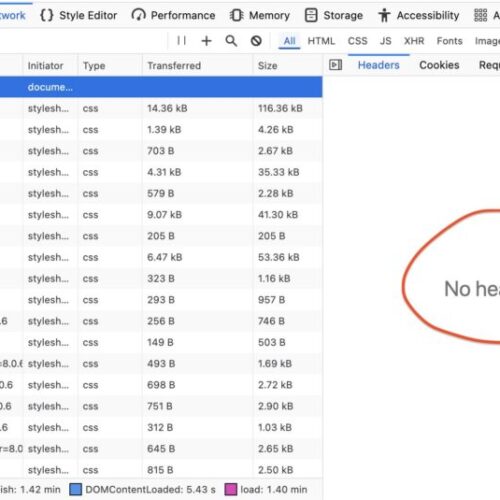
📷 Real Screenshots
Below are live snapshots taken during the optimization process — including DevTools, Query Monitor, database cleanup, and PageSpeed reports.
🔎 See full audit: https://speedwppro.com/free-audit/
🧪 Test result: PageSpeed Insights for milanis.top
🧩 Site #2: LikeToTravel.top — Plugin-Based Optimization for a Heavy Multilingual Real Estate Portal
Site type: Multilingual real estate website (focused on Tenerife, Canary Islands), targeting international tourists and property buyers.
🔍 Problem
Despite being well-designed and offering a multilingual experience, the site suffered from extreme frontend bloat:
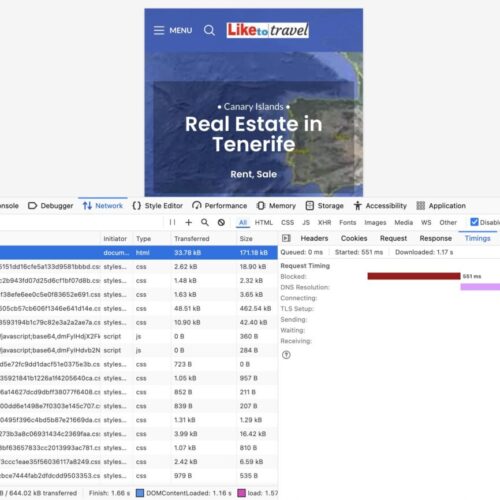
Over 1,080+ HTTP requests on the homepage (📷 see
network-requests-before-optimization.png)Poor performance on real mobile devices
Render-blocking styles and multiple JS/CSS assets from the Woodmart theme, WPBakery, WooCommerce
TranslatePress added extra complexity for each language
The client needed top-tier loading speeds without rebuilding the site or editing the database directly.
🛠 What We Did (100% Plugin-Based Approach)
✅ Used LiteSpeed Cache for:
Page cache, browser cache
Critical CSS generation per language
CSS/JS minify + deferred load
Lazy load for images & iframes
Dropped theme lazy loading to avoid conflicts
✅ Used Asset CleanUp to:
Disable redundant scripts/styles from plugins on non-essential pages
Prevent AJAX filters from loading on non-WooCommerce content
✅ Used Flying Scripts:
Delayed chat scripts and background analytics
✅ Used LiteSpeed’s media settings:
Combined with WebP delivery and responsive placeholders
✅ Ensured TranslatePress did not translate shortcodes or internal logic by excluding selectors from auto-translation
⚙️ Caching Strategy
Full-page cache for each language (
/en/,/ru/,/de/)Edge cache rules applied via Cloudflare
No database edits — only plugin configuration
Admin dashboard remains responsive due to low memory use
⚡ Results
| Metric | Before Optimization | After Optimization |
|---|---|---|
| HTTP Requests | ~1,080+ | ~420 (after delay and removal) |
| Mobile Speed Index | ~6.5s | 3.1s 📷 mobile-speed-graph.png |
| LCP (Mobile) | ~4.0s | 2.0s |
| Total Blocking Time | ~220ms | 10ms |
| PageSpeed Mobile Score | ~65 | 98 📷 pagespeed-mobile-liketotravel.png |
| PageSpeed Desktop Score | ~85–90 | 100 📷 pagespeed-desktop-liketotravel.png |
✅ All Core Web Vitals — GREEN
✅ No layout shifts (CLS under 0.01)
✅ Live version tested and stable at: https://liketotravel.top/en/
🔗 Full PageSpeed Test: View Report
🧰 Tools Used
LiteSpeed Cache, Asset CleanUp, Flying Scripts, TranslatePress, Cloudflare, DevTools, Query Monitor
📷 Real Screenshots
✅
pagespeed-mobile-liketotravel.png— Mobile performance: 98 score✅
pagespeed-desktop-liketotravel.png— Desktop: perfect 100✅
mobile-speed-graph.png— Real metrics breakdown✅
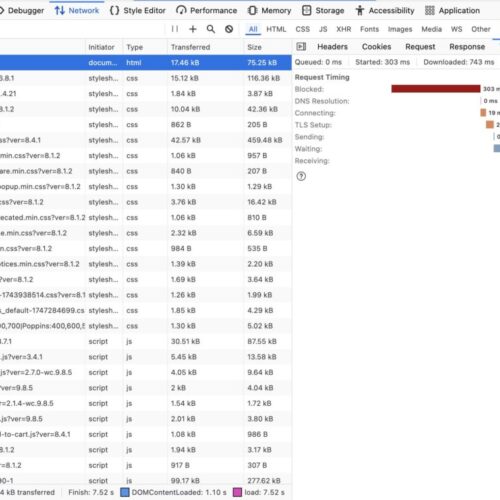
network-requests-before-optimization.png— 1087 requests before cleanup✅
network-summary-after.png— reduced requests and loaded size✅
query-monitor-liketotravel.png— Server stats, query usage, memory
🔎 Interested in similar results?
We offer multilingual-friendly optimization without touching your database.
📩 Request a free audit → https://speedwppro.com/free-audit/

