Free website checkup
Every site slows down over time — and your visitors feel it.
This hits hardest for online stores: users won’t wait, they’ll just leave.
Even if PageSpeed shows a green score, your site might still be slow in real life.
What’s causing it?
We’ll show you exactly what’s slowing down your site — and how to fix it. Or we can fix it for you. Your choice.
🅰️ A — Why Your Page Takes 13+ Seconds to Load: Explained Step by Step
![Screenshot A with labels 1–6]
This is not a lab test — it’s a real-world page load on stable Wi-Fi.
The user clicks the link... and waits. But why exactly?
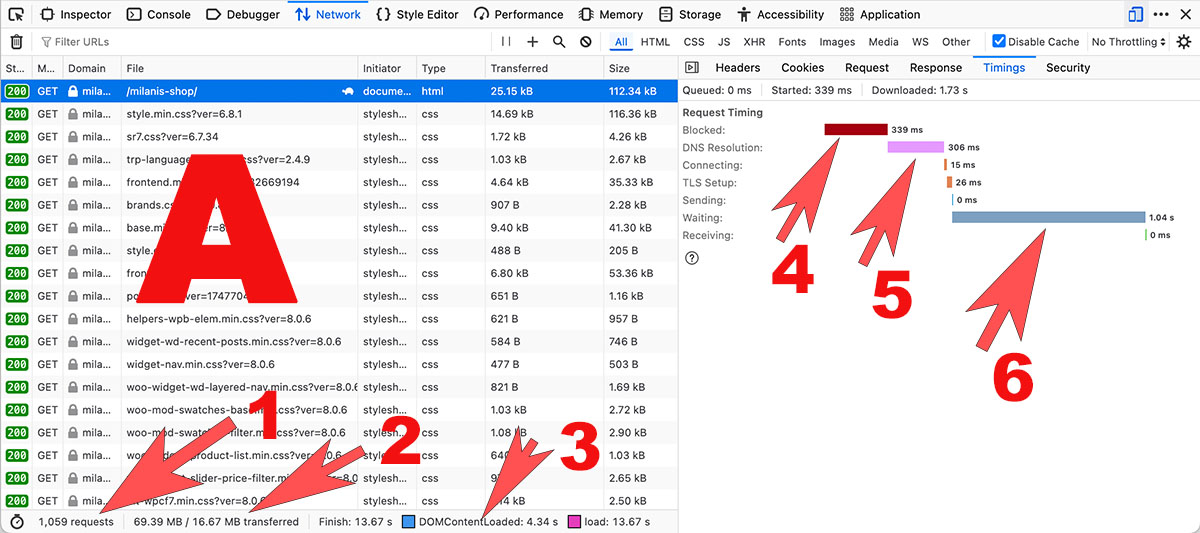
🔴 1. 1,059 requests
The site triggers over a thousand individual network requests.
Each image, CSS file, font, icon — they all load separately.
📌 The browser gets overwhelmed trying to handle so many resources at once.
🟠 2. 69 MB of data
The total weight of all page resources is nearly 70 MB.
Even if some of it comes from cache, this is way too much.
📌 A typical well-optimized page weighs 2–5 MB. This one is crippling the load time.
🟣 3. Full load time: 13.67 seconds
That’s how long it takes before the page is fully interactive.
Even if something appears earlier, the user can’t interact with it yet.
🟥 4. Blocked — 339 ms
The browser delays the request before even starting it — likely because of too many parallel downloads.
📌 These internal bottlenecks stack up and slow the entire load.
🟪 5. DNS Resolution — 306 ms
The browser takes over 300 ms just to resolve the domain name to an IP address.
📌 This suggests slow or misconfigured DNS, or an overloaded nameserver.
🔵 6. Waiting — 1.04 seconds
This is the most critical metric:
The browser waits over a full second for the server to respond after sending the request.
📌 This is when users stare at a blank screen — the site hasn’t even started replying.
📉 That’s the Real Problem
Google PageSpeed may show decent scores — especially if some caching is enabled.
But the real user experience is slow, frustrating, and invisible in those scores.
If your page takes over 10 seconds to respond — people leave.
✅ During our free audit, we show you exactly this — not abstract numbers, but how your site actually behaves in the browser.
🅱️ B — What Happens on 3G: The Page Barely Loads
![Screenshot B]
We switched Chrome DevTools to Good 3G to simulate the experience of a typical mobile user.
This is exactly how Google tests your site’s mobile performance in PageSpeed Insights.
Here’s what we saw:
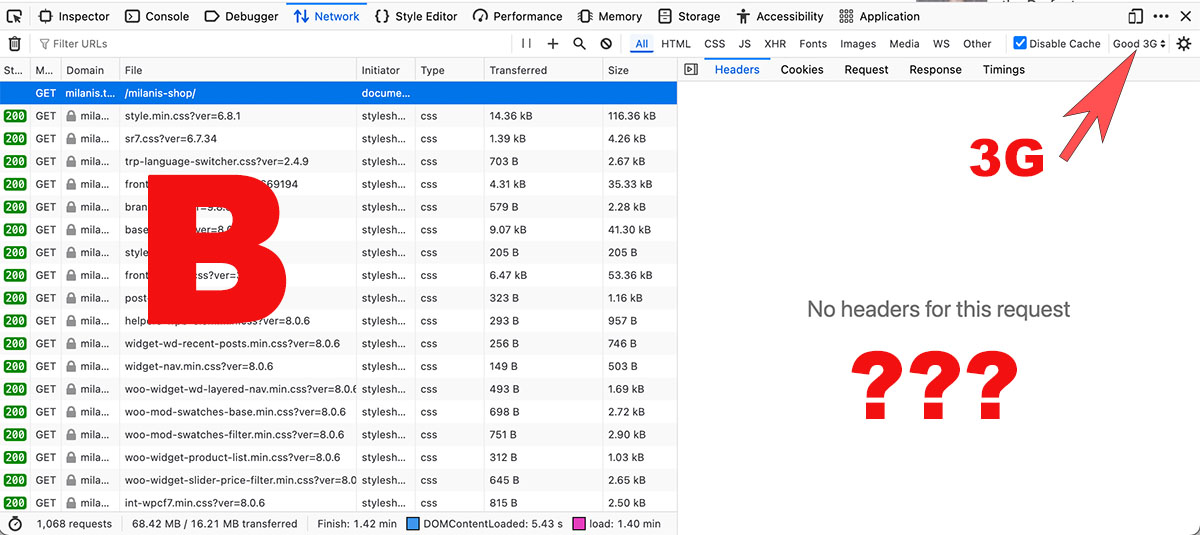
🟥 The page loaded in over 1 minute
At the bottom of the screen:
Total load time: 1.40 minutes
DOM content loaded after 5.43 seconds, but the site still wasn’t interactive
📌 For mobile users, this feels endless. Many leave long before the page finishes loading.
❓ “No headers for this request”
When clicking on the main document request, the browser showed:
No response headers at all.
This often means:
the server failed to respond in time
the browser gave up and cancelled the request
or something (like bad caching or a stuck plugin) blocked the reply
📶 3G exposes the real problems
Fast desktop connections often mask performance issues. On mobile:
Every unnecessary script or plugin adds seconds
Page weight becomes a critical problem
Server delays feel much worse
Even with caching plugins, your site can still feel slow — especially for first-time mobile visitors.
They don’t see speed scores. They see spinners, blank screens, and broken UX.
✅ During your free audit, we test your site on Wi-Fi and 3G — and show what your visitors actually experience.
🅲 C — Which Plugin Slows Down Your Site? We’ll Show You Exactly
![Screenshot C with markers 1–2]
Your site might look fine on the outside — but behind the scenes, something is quietly slowing it down.
In most cases, the real reason is plugins: some of them overload the database, inject heavy scripts, or conflict with your theme.
We access your WordPress admin, install Query Monitor, and take a look at what’s really going on.
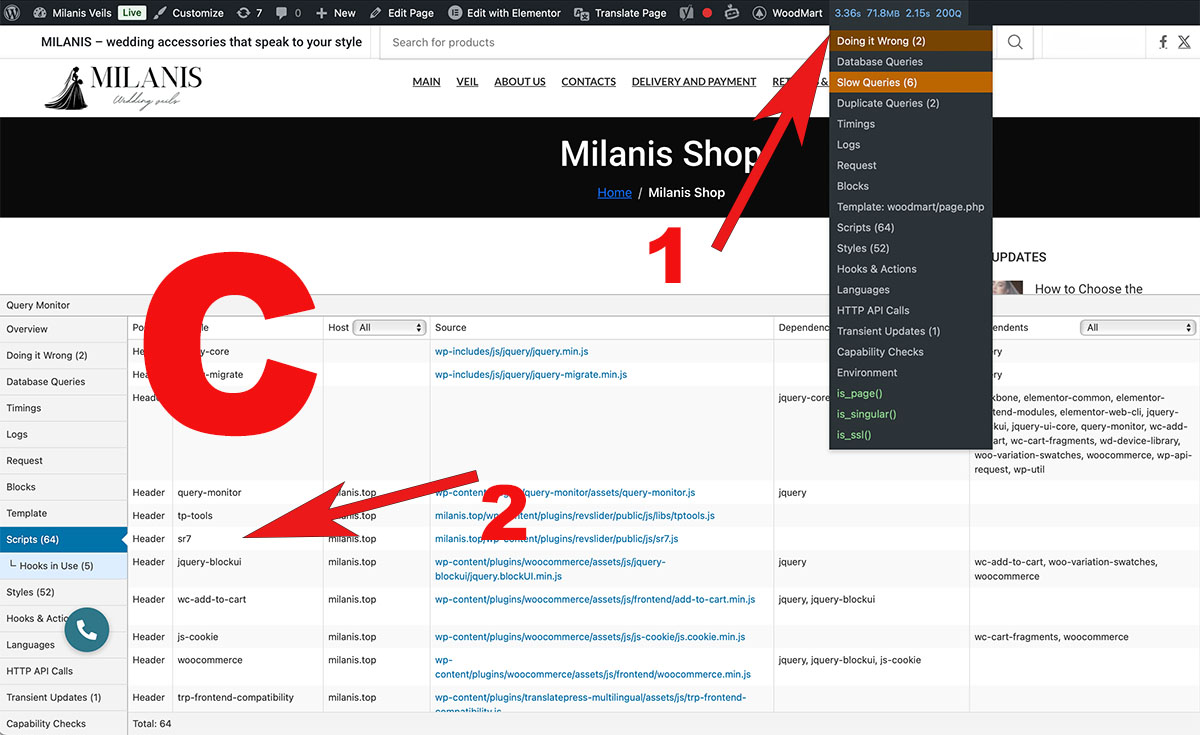
🟥 1. "Doing it Wrong" and "Slow Queries" tabs (arrow 1)
Here we see:
Deprecated functions still being called — a sign of outdated or sloppy plugin code
Slow SQL queries that run on every page load
The exact plugin or theme file responsible for those queries
📌 This shows which plugin is overloading the database or using poor practices that add delay on every request.
🟪 2. "Scripts" tab (arrow 2)
This reveals:
All the JavaScript files being loaded
Which plugin or theme each file comes from
Even scripts that load on every page, but aren’t needed there
📌 For example:
sr7.js— from a slider plugin, loaded on all pages even if not usedtp-tools— loads its assets globally without reasonjquery-blockui,wc-add-to-cart— WooCommerce scripts on non-product pages
📌 What does this give us?
We can precisely identify:
Which plugins run the most or slowest database queries
Which scripts are unnecessary bloat
What can be safely disabled, replaced, or optimized
And the best part: none of this is visible in PageSpeed or DevTools.
✅ During your free audit, we will:
Install Query Monitor
Show you which plugins are hurting performance
Recommend what to disable, replace, or fix — clearly and professionally
Request Your Free Audit
We'll review your site and get back to you within 24 hours — guaranteed.